2. Distance Determination
An EDM uses the EM signal structure and determines distance using a phase shift. The EM signal has a sinusoidal wave form. Remember from trigonometry that the sine curve looks like, Figure F-3:
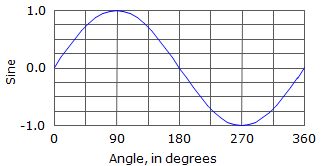 |
| Figure F-3 Sine Curve |
This wave form repeats every 360°. The distance between wave form ends is the wavelength, λ, Figure F-4.
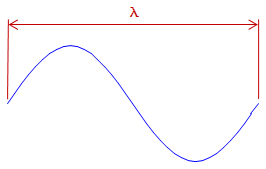 |
| Figure F-4 Wavelength |
Different wavelengths are generated at different modulation frequencies, f. Wavelength, frequency, and the speed of light are related by:
| λ = c/f | Equation F-1 | |
| λ: wavelength c: speed of light f: frequency |
||
The wavelength is a known quantity since it is generated by the EDM at a specific frequency. The signal leaves the EDM at 0° phase, goes thru N number of full phases on its path to then from the reflector, and returns to the EDM at some angle between 0° and 360° creating a partial wavelength, p, Figure F-5:
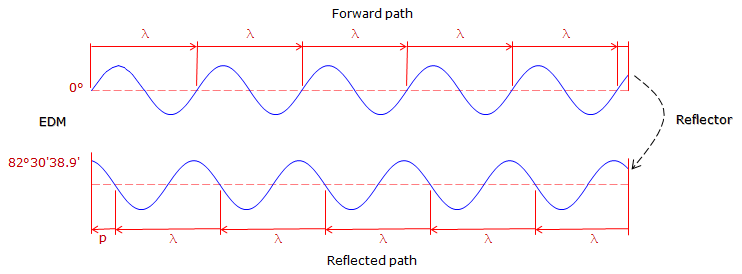 |
| Figure F-5 Phase Shift |
The EDM can very accurately determine the length of the last partial wavelength from its phase. The total EDM-reflector-EDM distance is (Nλ + p).
Example: The wavelength in Figure F-5 is 20.00 ft.There are 10 full wavelengths before the last partial one. What is the EDM to reflector distance?
The last partial wave is: p = (82°30'39.9"/360°00'00") x 20.00 ft = 4.584 ft
Including the full wavelengths the total distance EDM-reflector-EDM is: 10 x 20.00 ft + 4.854 ft = 204.584 ft
The distance between the EDM and reflector is half that: 204.584 ft / 2 = 102.292 ft.
Unfortunately, while the EDM can accurately measure the last partial wavelength, it doesn't know how many full wavelengths occurred before it (this is similar to the integer ambiguity in carrier-based GPS measurements).
So how does the EDM resolve this dilemma?
By decreasing the frequency by a factor of 10 and repeating the process. Decreasing the frequency by a factor of 10 increases the wavelength by a like amount. The partial wavelength at this level will give the next higher distance digit. This is repeated a number of times until the distance is resolved.
Figure F-6 illustrates three frequencies each folded out to show a continuous EDM-reflector-EDM path:
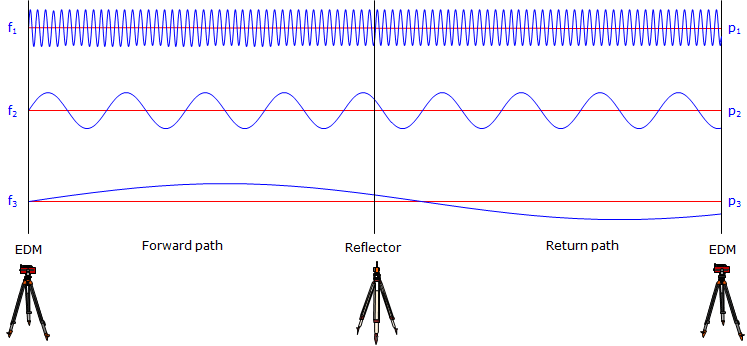 |
| Figure F-6 Multiple Frequencies |
Example: The following table shows the last partial length for each of 4 different wavelengths. What is the total distance EDM-reflector?
| λ, m | p, m | dist, m |
| 10.00 | 3.68 | |
| 100.0 | 53.7 | |
| 1,000 | 454 | |
| 10,000 | 8450 |
The digits in bold represent the digits added to the distance as a result of each partial wavelength.
| λ, m | p, m | dist, m |
| 10.00 | 3.68 | 3.68 |
| 100.0 | 53.7 | 53.68 |
| 1,000 | 454 | 453.68 |
| 10,000 | 8450 | 8453.68 |
The total distance is 8456.68 m; the EDM-reflector distance is 8453.68/2 = 4226.84 m