2. Historical Background
Prior to the NAD 83 readjustment C&GS (now NGS) maintained records in written form. Control information was conveyed to users in paper form called datasheets using a simple standardized format.
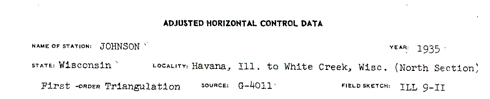
Figure I-1 is the datasheet for control point Johnson; click here for a pdf version
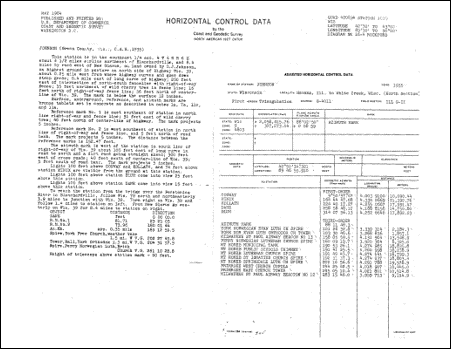 |
| Figure I-1 Johnson Datasheet |
Most control points had a single one-sided datasheet. Because they were not occupied, two third-order intersection stations were commonly included together on a single datasheet sude.
a. Identification
The top of the datasheet identifies the datum, Figure I-2, and point identification, Figure I-3.
 |
 |
| Figure I-2 Datum |
Figure I-3 Point Identifier |
Each point is uniquely is identified by a quadrangle index and number.
QUAD
The quadrangle is 30-minute by 30-minute area identified by its southeastern corner. Digits one and two are the latitude degrees, digits three through five are the longitude degrees. The sixth digit is a quadrant: 1-NE, 2-SE, 3-SW, 4-NW. Figure I-4 is an explanatory note on a Wisconsin State Triangulation Index map.STATION
Figure I-4
Note on State Triangulation Index Map
The station number is a sequential number, beginning with 1001, within the quad.Additional information
LATITUDE and LONGITUDE are the extent of the quadrangle.Johnson is point number 1015 in the NW quadrant of the 42°30-43°00' x 89°30'-90°00', Figure I-5.
DIAGRAM is the 2-degree by 1-degree USGS topoquad.
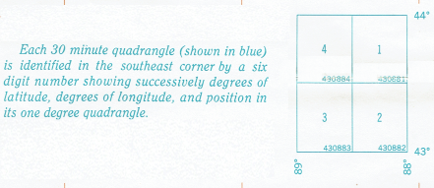
Figure I-5
Quad 4 of Quadrangle 42089
b. Location and Monument
The left side of the datasheet, Figure I-6, describes the point's general location, monumentation, and accessory information.
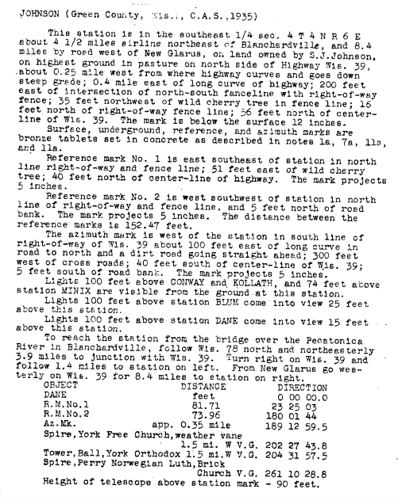 |
| Figure I-6 Monument and Location |
It may also include observation condition information.
Yup, the targets were set 100 ft above some points and the instrument (and operator) was 25 feet above Johnson.
Historical Note
In order to sight long distances and see above obstructions, instrument and target towers were often used. Various non-standard wooden and metal towers were used until 1926 when Jasper Bibly introduced his namesake steel towers. They were sturdy and designed for transportation, erection, use, and teardown efficiency so were quickly adopted for geodetic surveying. The NGS Historical Photo Archives has some great images of towers and the surveyors brave enough to scale them. If you think centering a total station ~5.5 ft above a ground mark can be a challenge, consider centering a theodolite 100+ ft above a ground mark..
c. Position Information
The right side of the datasheet contains specific position information and connections to other control points.
(1) Network information, Figure I-7
 |
| Figure I-7 Network Information |
Johnson is a first order triangulation station established in 1935.
(2) Grid information, Figure I-8
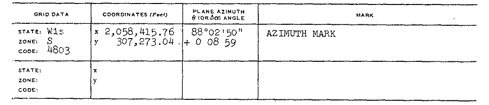 |
| Figure I-8 Grid Information |
Multiple coordinates could be shown if the point was near the edge of a zone.
For point Johnson: Wisconsin South SPC zone
Coordinates
Convergence
Grid azimuth to the azimuth mark
(3) Geodetic information, Figure I-9
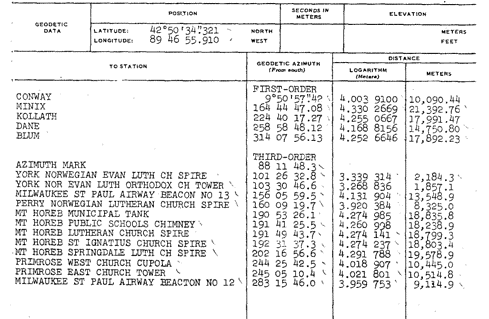 |
| Figure I-9 Geodetic Information |
Geodetic coordinates, elevation (if available), and azimuths and directions to other control points observed. Not all control points will have this latter information.
Because Johnson was part of a first order triangulation network, it includes observations to other network points as well as other visible points.