5. Scale Effect
Scale affects map generalization and resolution.
a. Generalization
Generalization has to do with how much data is necessary to depict features.
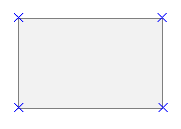
On a small scale map, a rectangular building location may be identified by a symbol plotted at single data point, Figure C-12(a). On a large scale map, four data points might be used to plot the building, Figure C-12(b).
 |
|
| (a) Small scale | (b) Large scale |
| Figure C-12 Data at Different Scales |
|
The large scale map has a greater data density than the small scale map.
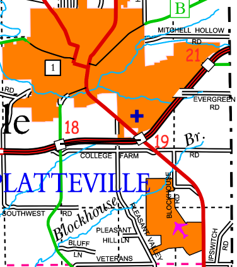
Figure C-13 are portions of two different maps of the Platteville area. They are shown in their correct relative size based on their compilation scale.
 |
|
| (a) State Highway Map 1:800,000 |
(b) County Map 1:100,000 |
| Figure C-13 Platteville Area at Two Scales |
|
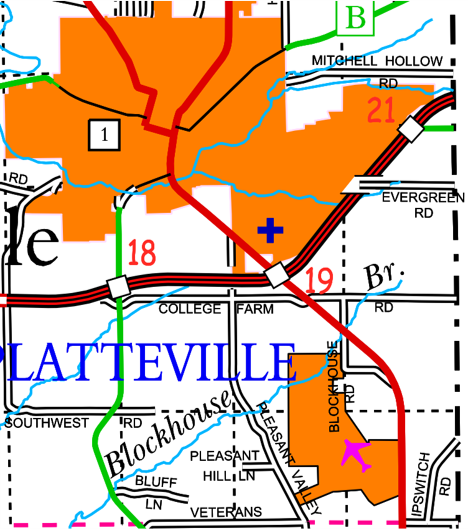
Figure C-14 shows the small scale State Highway map enlarged to the same scale as the County map.
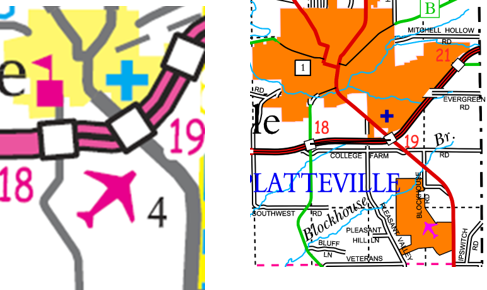 |
| Figure C-14 Platteville Area at Same Scale |
The generalization effect at of the enlarged map is immediately apparent. There are fewer features since many of them are not visible at 1:800,000. The features that are shown lack the detail of the same features on the 1:100,000 map. Magnifying the Highway map magnifies symbol dimensions. It also magnifies errors.
Figure C-15 is the same area from a 1:24,000 topoquad (because it's so much larger in relation to Figure C-13, it is shown at 75%)..
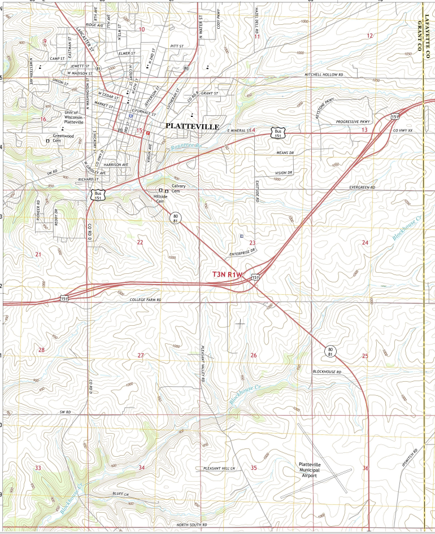 |
| Figure C-15 Platteville Area from 1:24,000 topoquad |
Figure C-16 is the 1:100,000 County Highway map from Figure C-12(b) enlarged to the scale of Figure C-15.
 |
| Figure C-16 Platteville Area 1:100,000 Map Enlarged to 1:24,000 |
As before, the small scale map exhibits generalization when magnified to a larger scale.
Notice the progression:
1:800,000 is generalized compared to 1:100,000 which in turn is generalized compared to 1:24,000
Why not just collect data at the 1:24,000 density and use it to create the 1:800,000 map?
Cost. That's a lot of data to collect and mange to create the small scale map.
Generalization is tied to the scale which in turn is tied to user need.
b. Resolution
Think of map resolution as how accurately features are depicted. Resolution affects map use two ways:
- Extracting information from the map
- How map data is collected
The second effect will be discussed in a later chapter on topographic mapping.
For now, we'll concentrate om the first: using the map.
A paper map has built-in accuracy limitation: the measuring device. The map in Figure C-17 is plotted at 1 in = 200 ft.The distance between the northwest and southeast corners of Lot 6 is measured using a 20-scale. Each division on the scale is 10 feet; a distance can be realistically determined to the nearest half-division on the scale. In addition to half-division estimation, scale must be centered on the symbols at both corners. At best, we can estimate the distance at 665 feet.
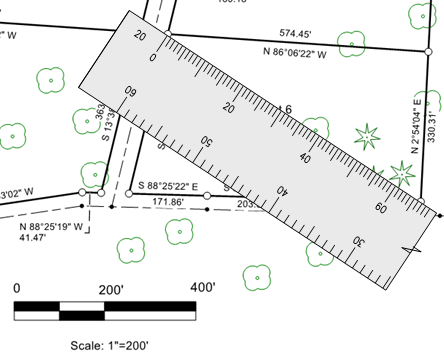 |
| Figure C-17 Measurement on a Paper Map |
Does enlarging the map increase accuracy or measurement ease? Consider Figure C-13. Data collection accuracy at 1:100,000 is higher than that required at 1:800,000. Not only are symbol sizes increased with enlargement making measurement more difficult, so are mapping errors. Enlarging a map does not make its data better.
Which brings us to digital maps.
Although digital maps are generally drawn full size and therefor scaleless, their features are still dependent on data density and collection accuracy. A digital map, just like its physical counterpart, is compiled at an accuracy to meet a need. Using the map for any purpose at or below the compilation accuracy is fine.
A digital map is easy to enlarge, much easier than a paper map. Unlike a paper map, feature symbols generally do not increase. Figure C-18 is Lot 6 on a digital map shown at two different scales. Symbols sizes and line weights are the same at both scales.
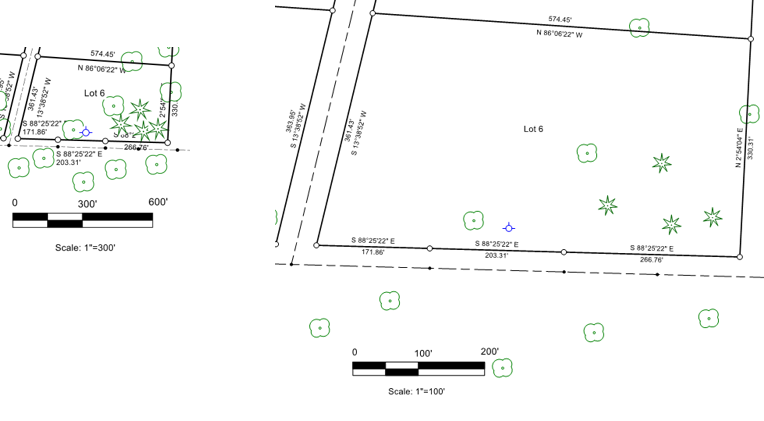 |
| Figure C-18 Enlarged Digital Map |
Measurement in a digital environment is not limited by a physical device. Measurement is one of many software functions. Results will be shown to the number of decimal places set in the software, not based on feature uncertainty. Figure C-19 is the software computed distance between the northwest and southeast corners of Lot 6 in Figure C-18.
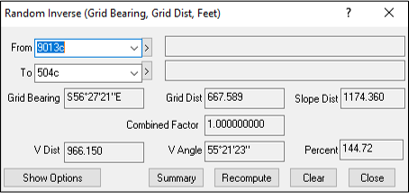 |
| Figure C-19 Digital Measurement |
The distance is given to 0.001 ft. Is it that accurate? What if the corner locations were good to only to ±0.5 ft? The software does not propagate feature uncertainty into computed measurements. A digital environment can result in a false sense of accuracy.
How can the user determine map resolution?
On most physical maps, accuracy is not generally specified. Is is implied from the map's:
- purpose
- compilation technique
- original scale
In Wisconsin, for example, legal maps are based on surveys having specific measurement accuracy standards.
Some paper maps did provide accuracy information. When still produced and distributed in paper form, USGS topoquads included the statement "This Map Complies With National Map Accuracy Standards." This was a formal horizontal and vertical accuracy standard for smaller scale maps.
What about digital maps? It depends on the type of map and how it is compiled. Many contemporary digital maps, particularly those created in Geographic Information Systems (GIS) include metadata. Metadata is information about the map including some indication of its data source, compilation, and accuracy. Traditional maps, such as Wisconsin legal maps, created in a digital environment must conform to the same standards as their physical equivalents.
Many digital maps, however, are bereft of accuracy information. The user has to determine applicability of digital information based on whatever information can be gleaned from its purpose or data source(s).
A scale-less environment can introduce as many problems as the advantages it brings.